MINDflow
From Data to direct Feedback
MINDflow is a software for visualizing spaces and processes. Its purpose is to visualize complex information in an appealing and understandable way. The application supports the communication of data, relationships, and processes visually and interactively. Turn data from the real world into a real time 3D simulation and change individual parameters to see the effects immediately.
- With MINDflow, Data becomes tangible
- The operation of the software is very simple
- Real time feedback
- Individual data interfaces can be developed upon request
Spaces
A room, a floor, a building or terrain: MINDflow can reproduce everything in a meaningful image.
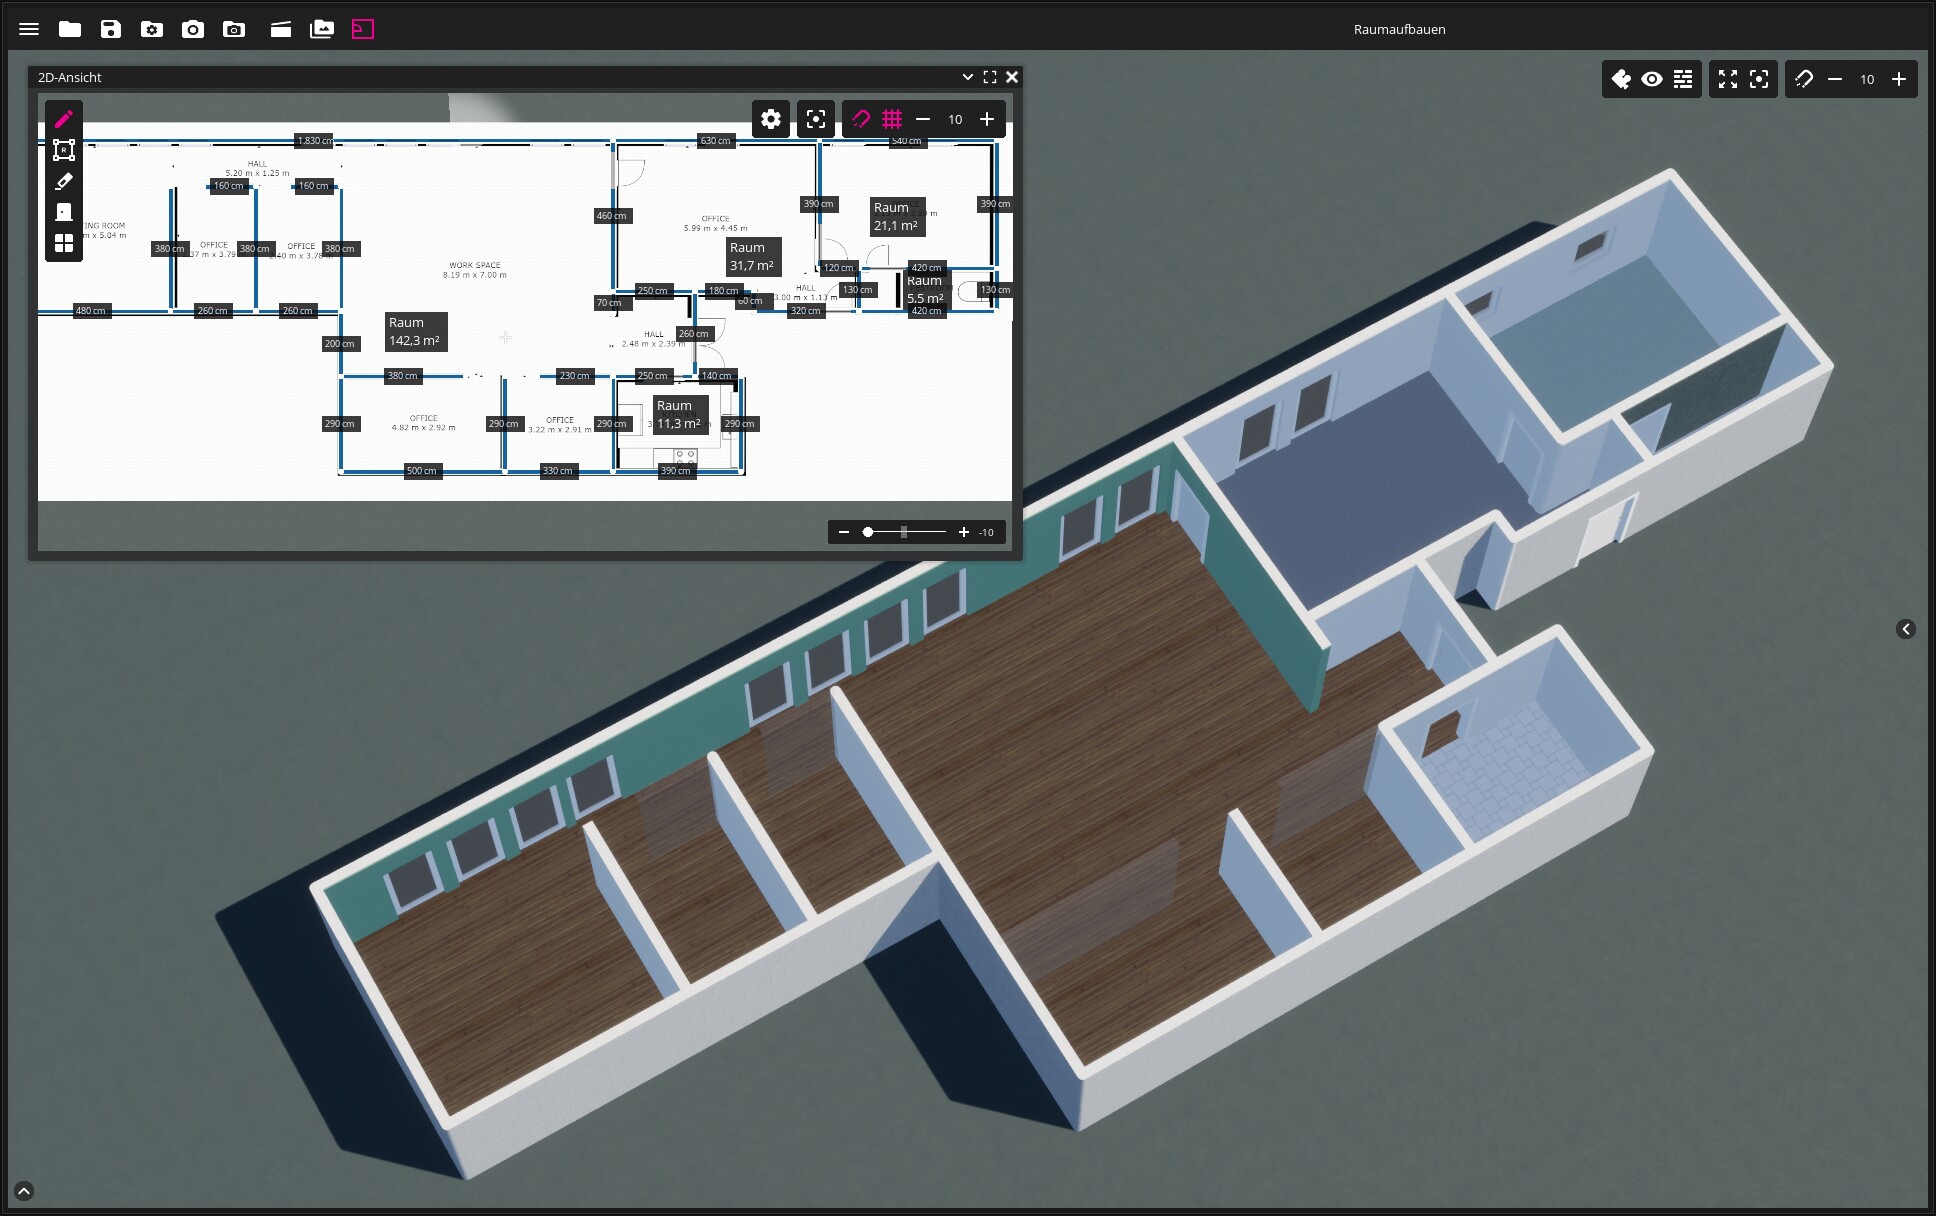
Drawing Rooms
Draw your rooms with just a few steps or go freestyle. Show variants and options, confidure in real time and get a 3D result immediately.
- Optionally load and scale floor plan
- (Re)draw walls and rooms
- Add doors and windows, each individually configurable
- Apply materials and color to walls, floor and ceiling
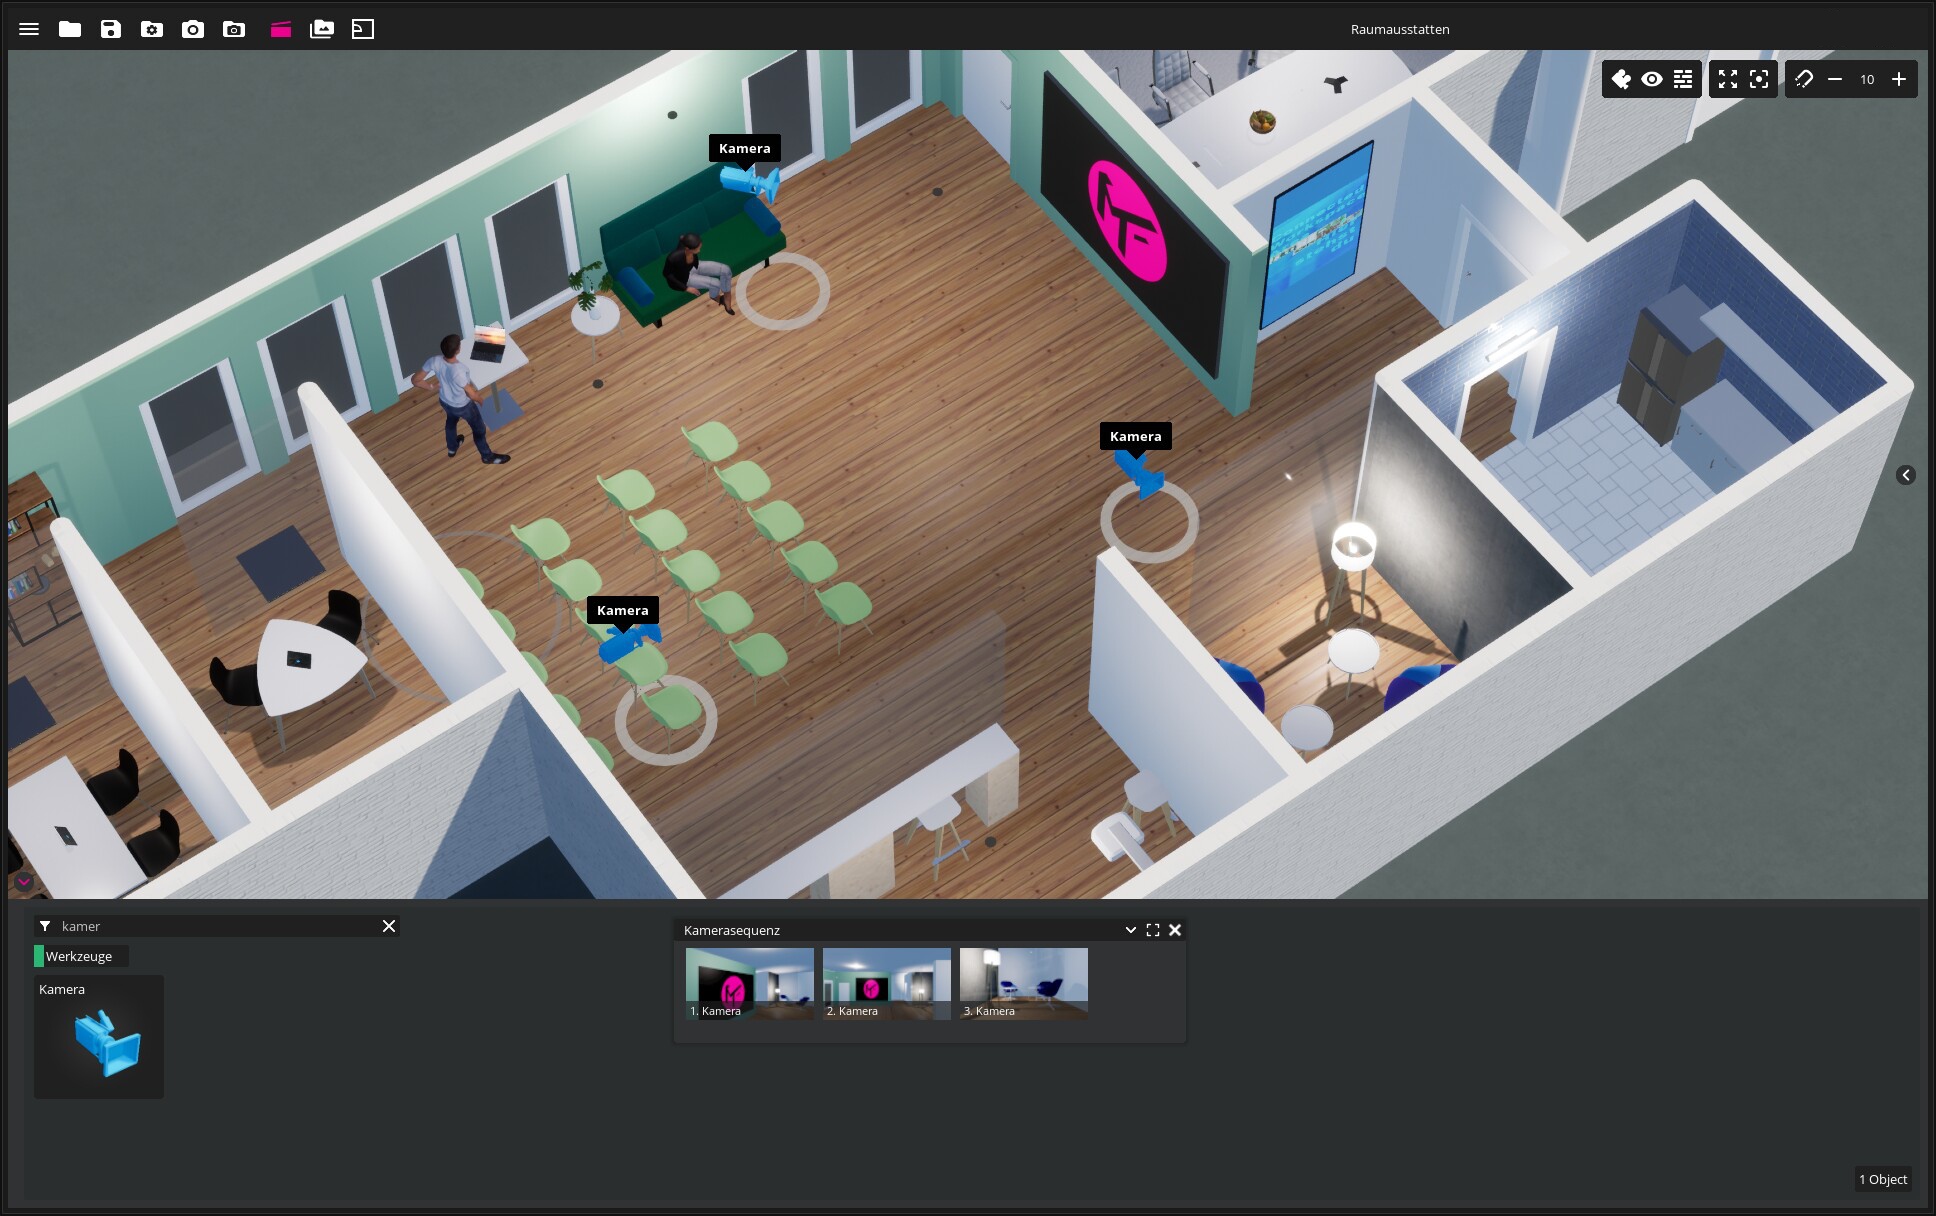
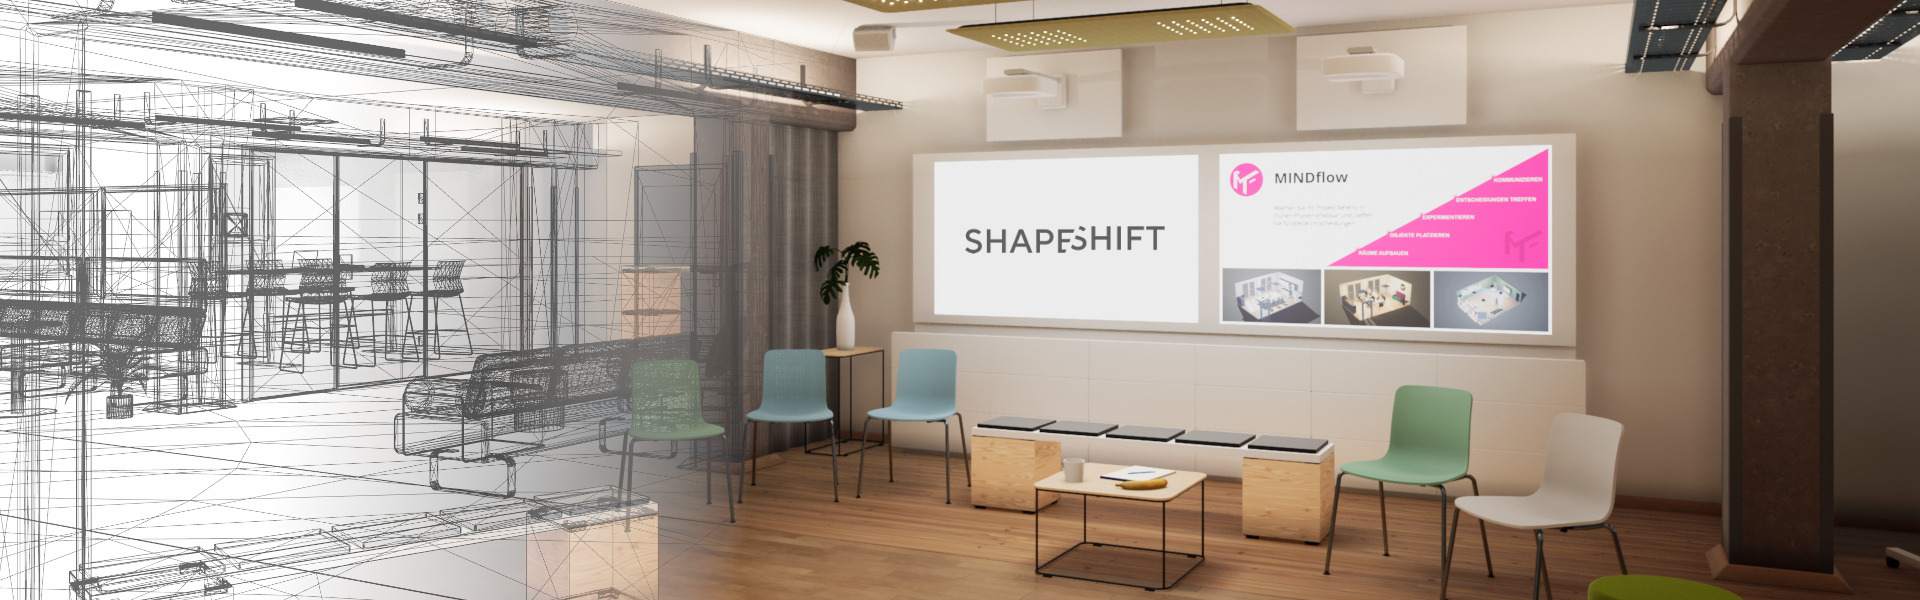
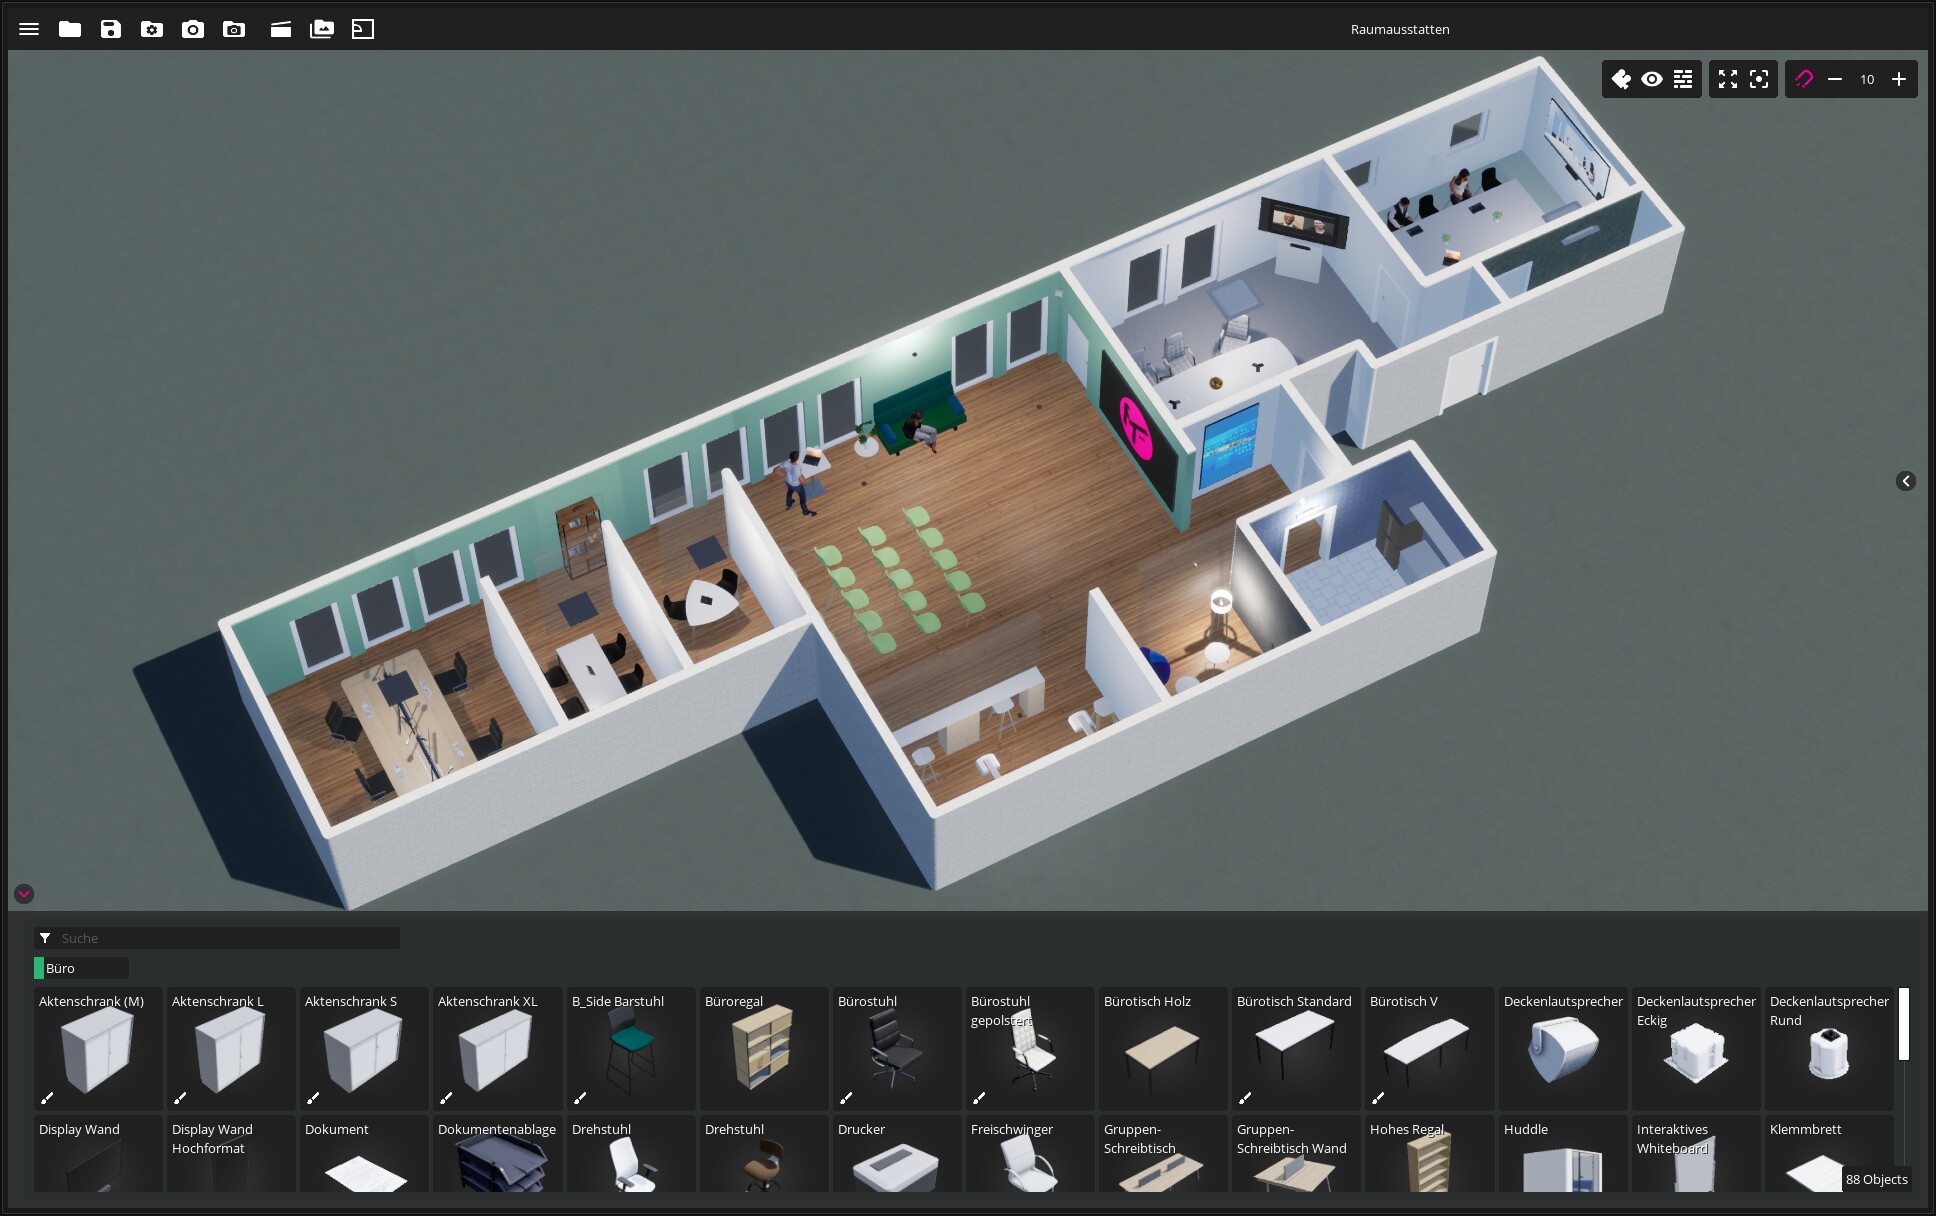
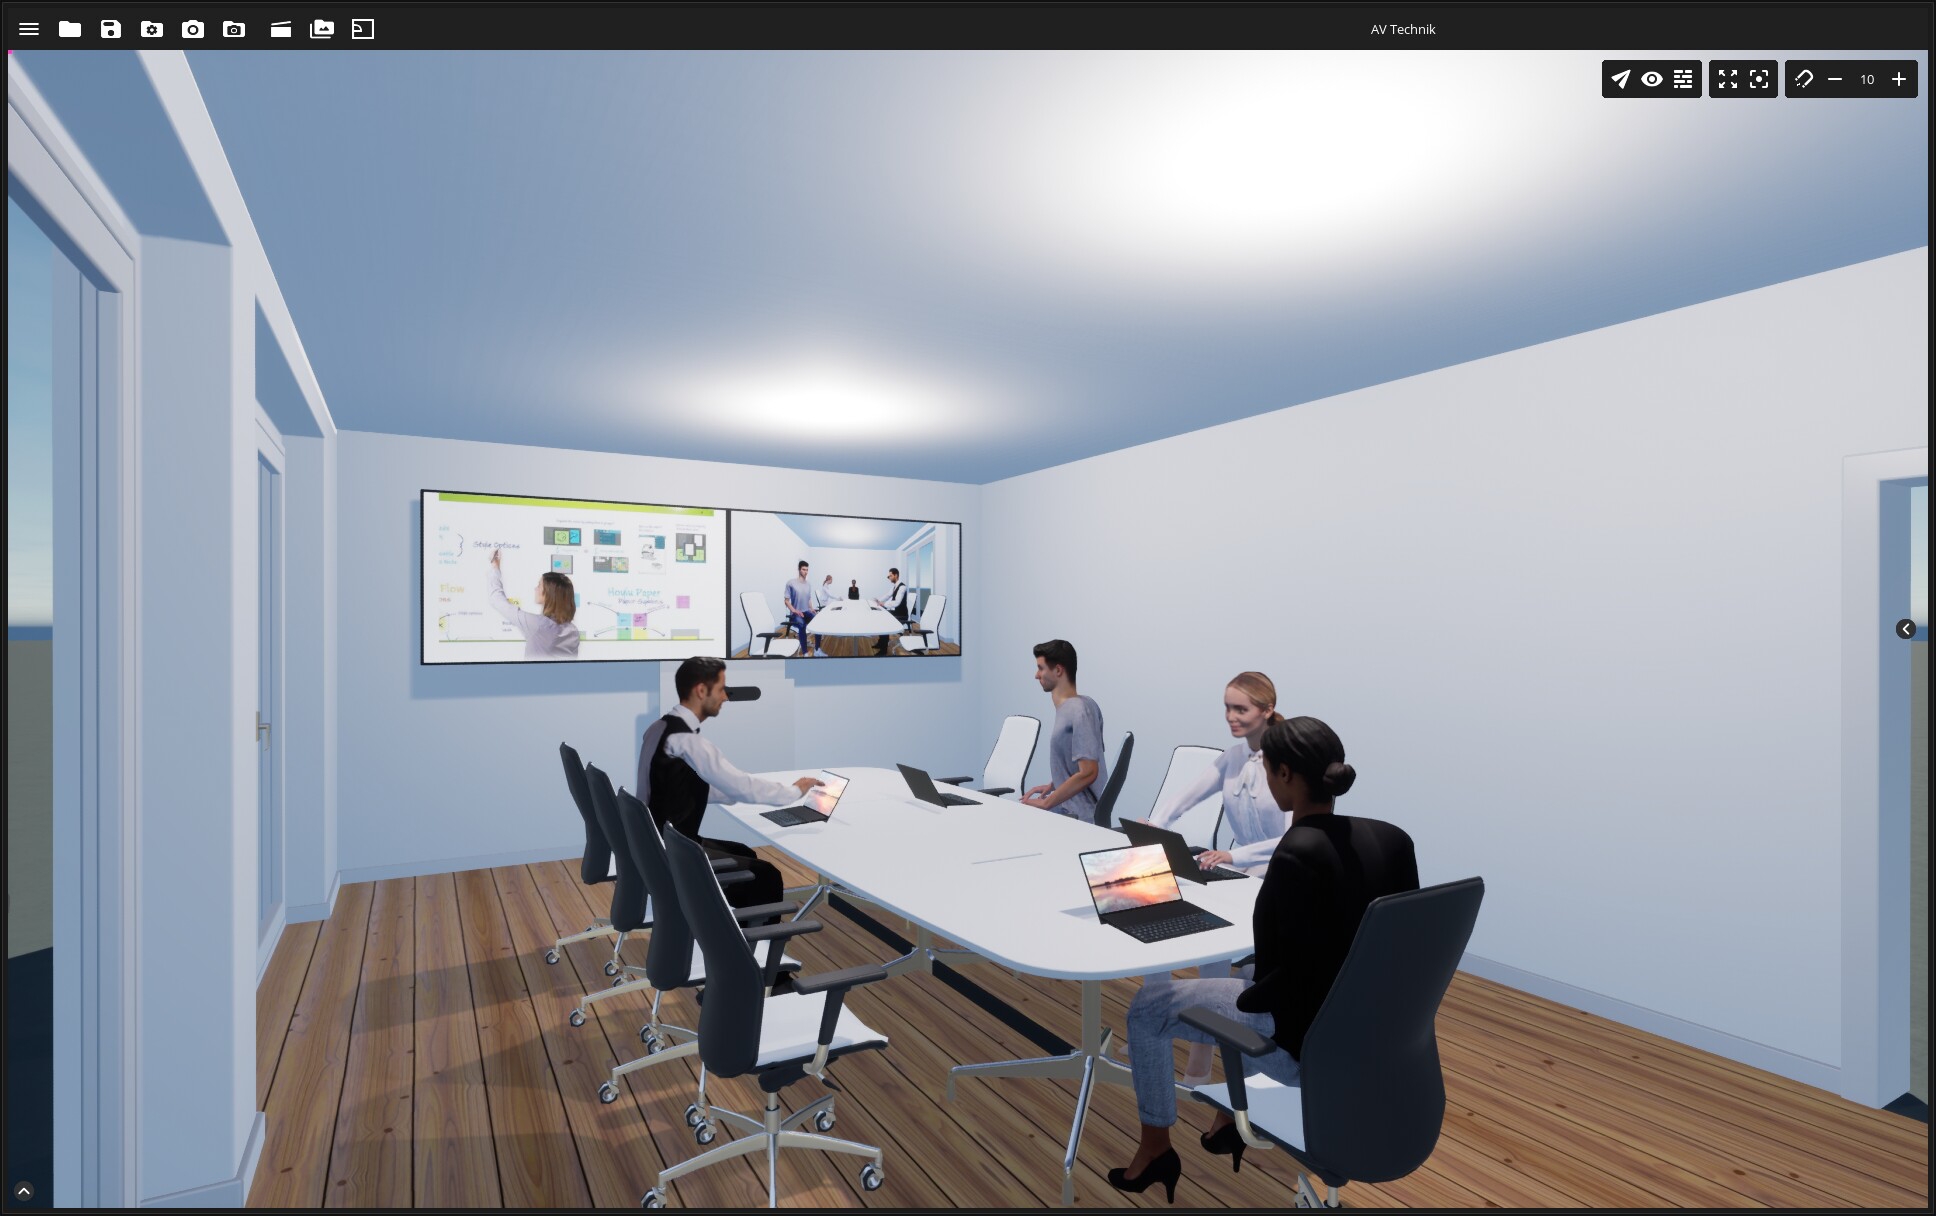
Furnishing Rooms
Equip your spaces with high quality 3d models.
- Configure and adjust objects individually
- Create lighting scenes with adjustable lamps and simulate the course of the sun
- Liven up the environment with animated people
- Place your own content as posters
- Show presentations via interactive displays
Process
Freely create or import recorded process data from the real world.
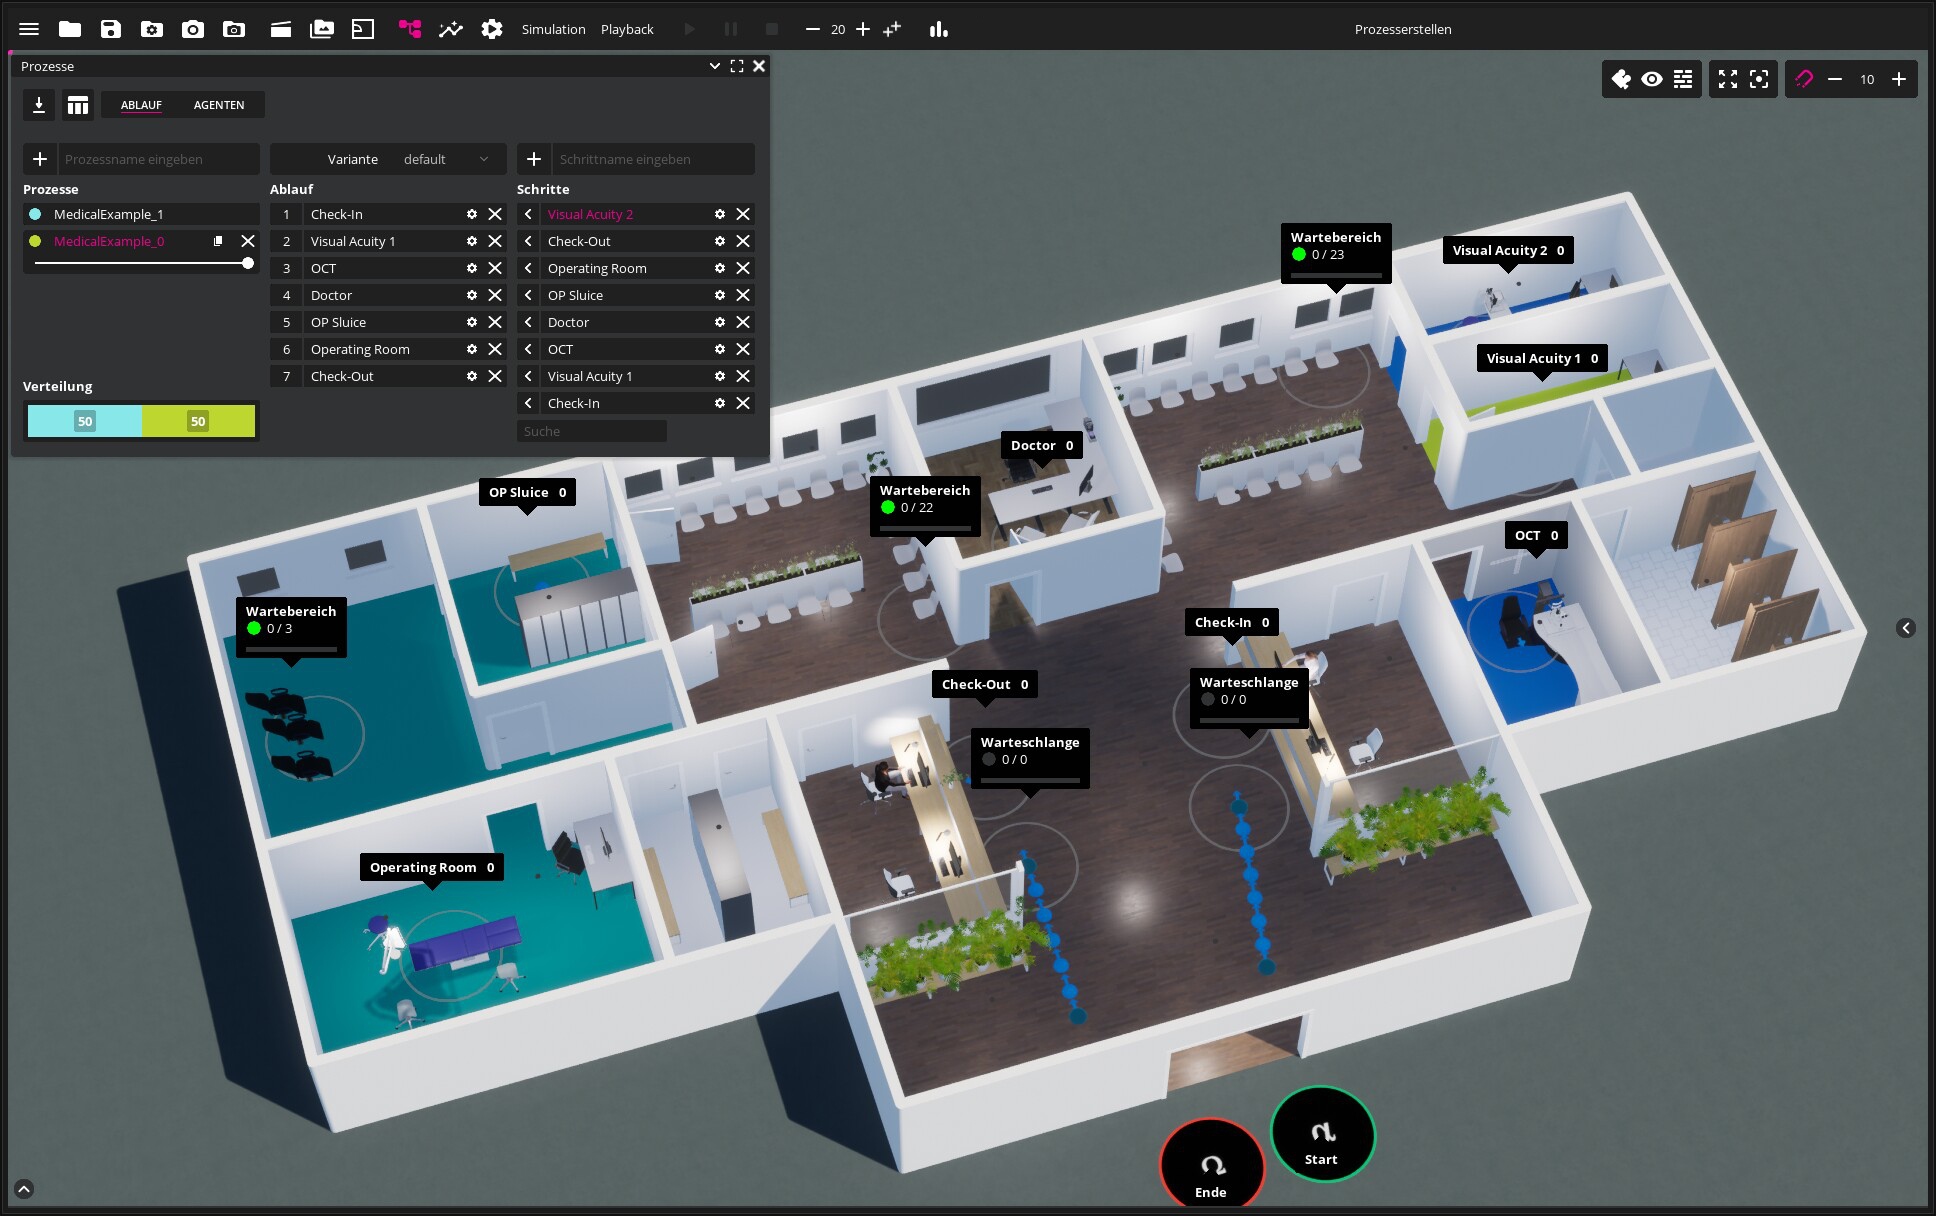
Process Building
Create a spatial reference to your processes. Give your data a visual representation in time and space.
- Define or import steps, procedures and processes
- Place stations and assign steps
- Create waiting areas and queues
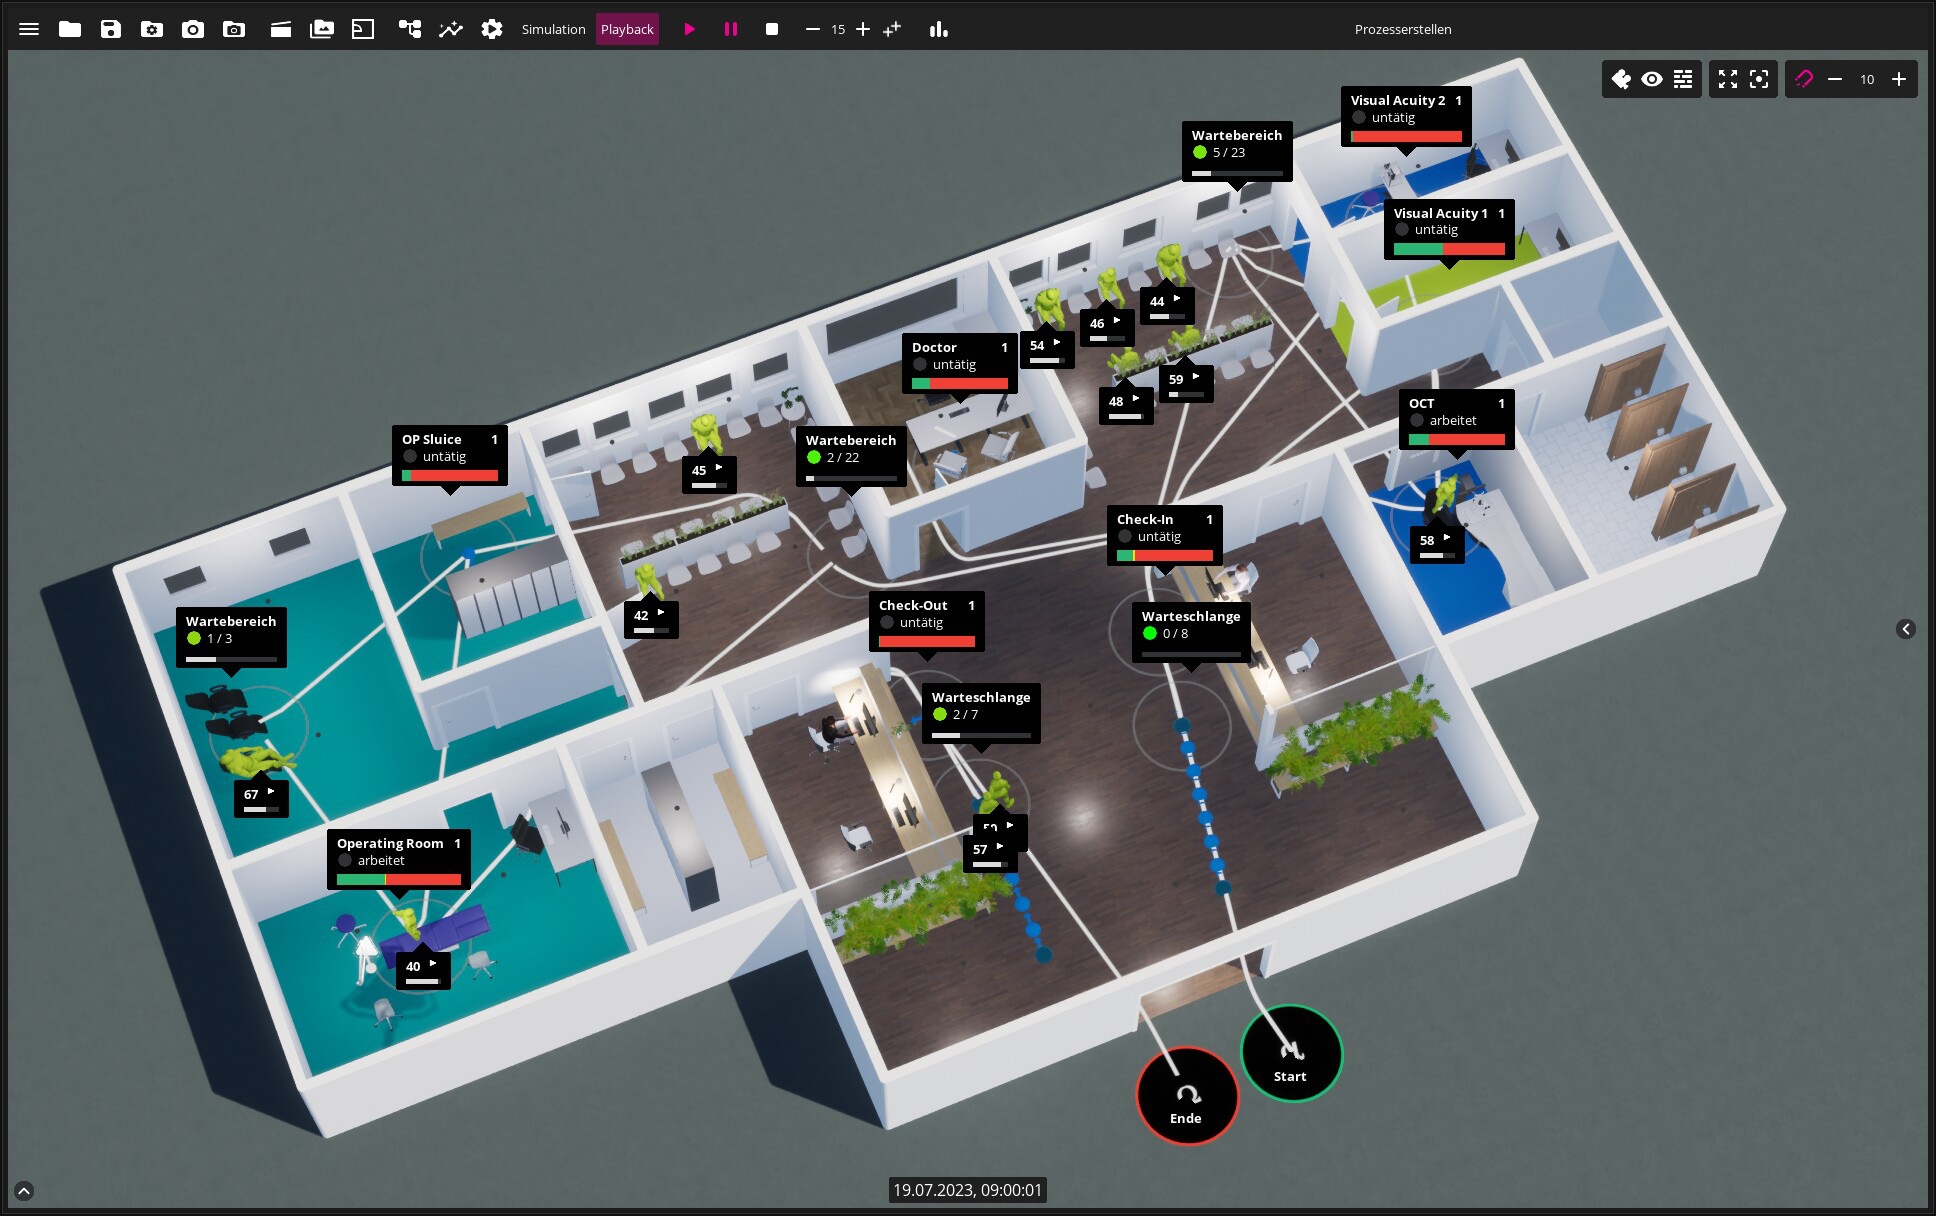
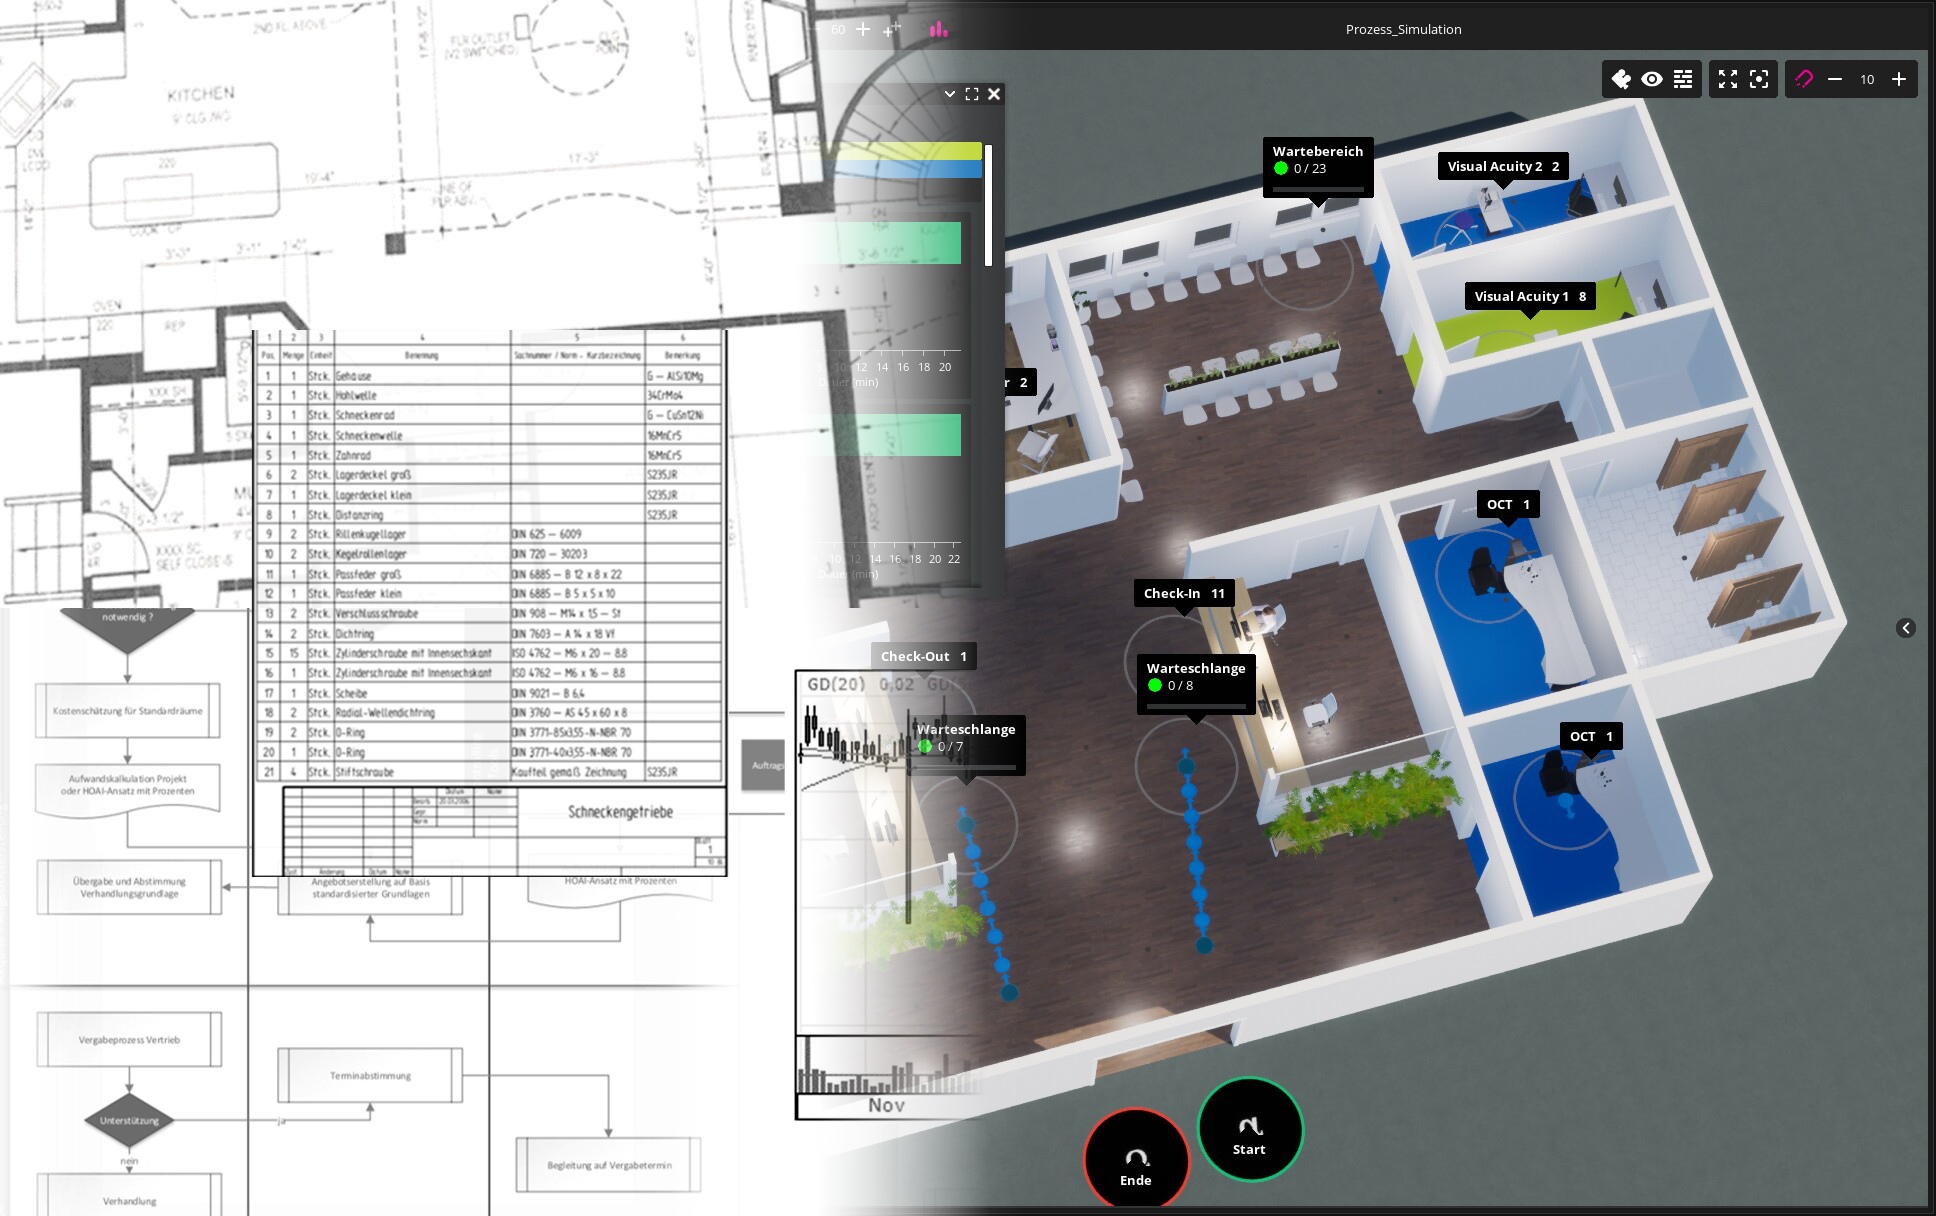
Playback of Real Data
Demonstrate and analyze the actual state: process data is read and processed. Play back the process flow and bring your 3D environment to life.
- Simultaneous execution of different processes
- Animated 3D characters for people-related processes
- Live display of process parameters and data
- Dashboard for data analysis
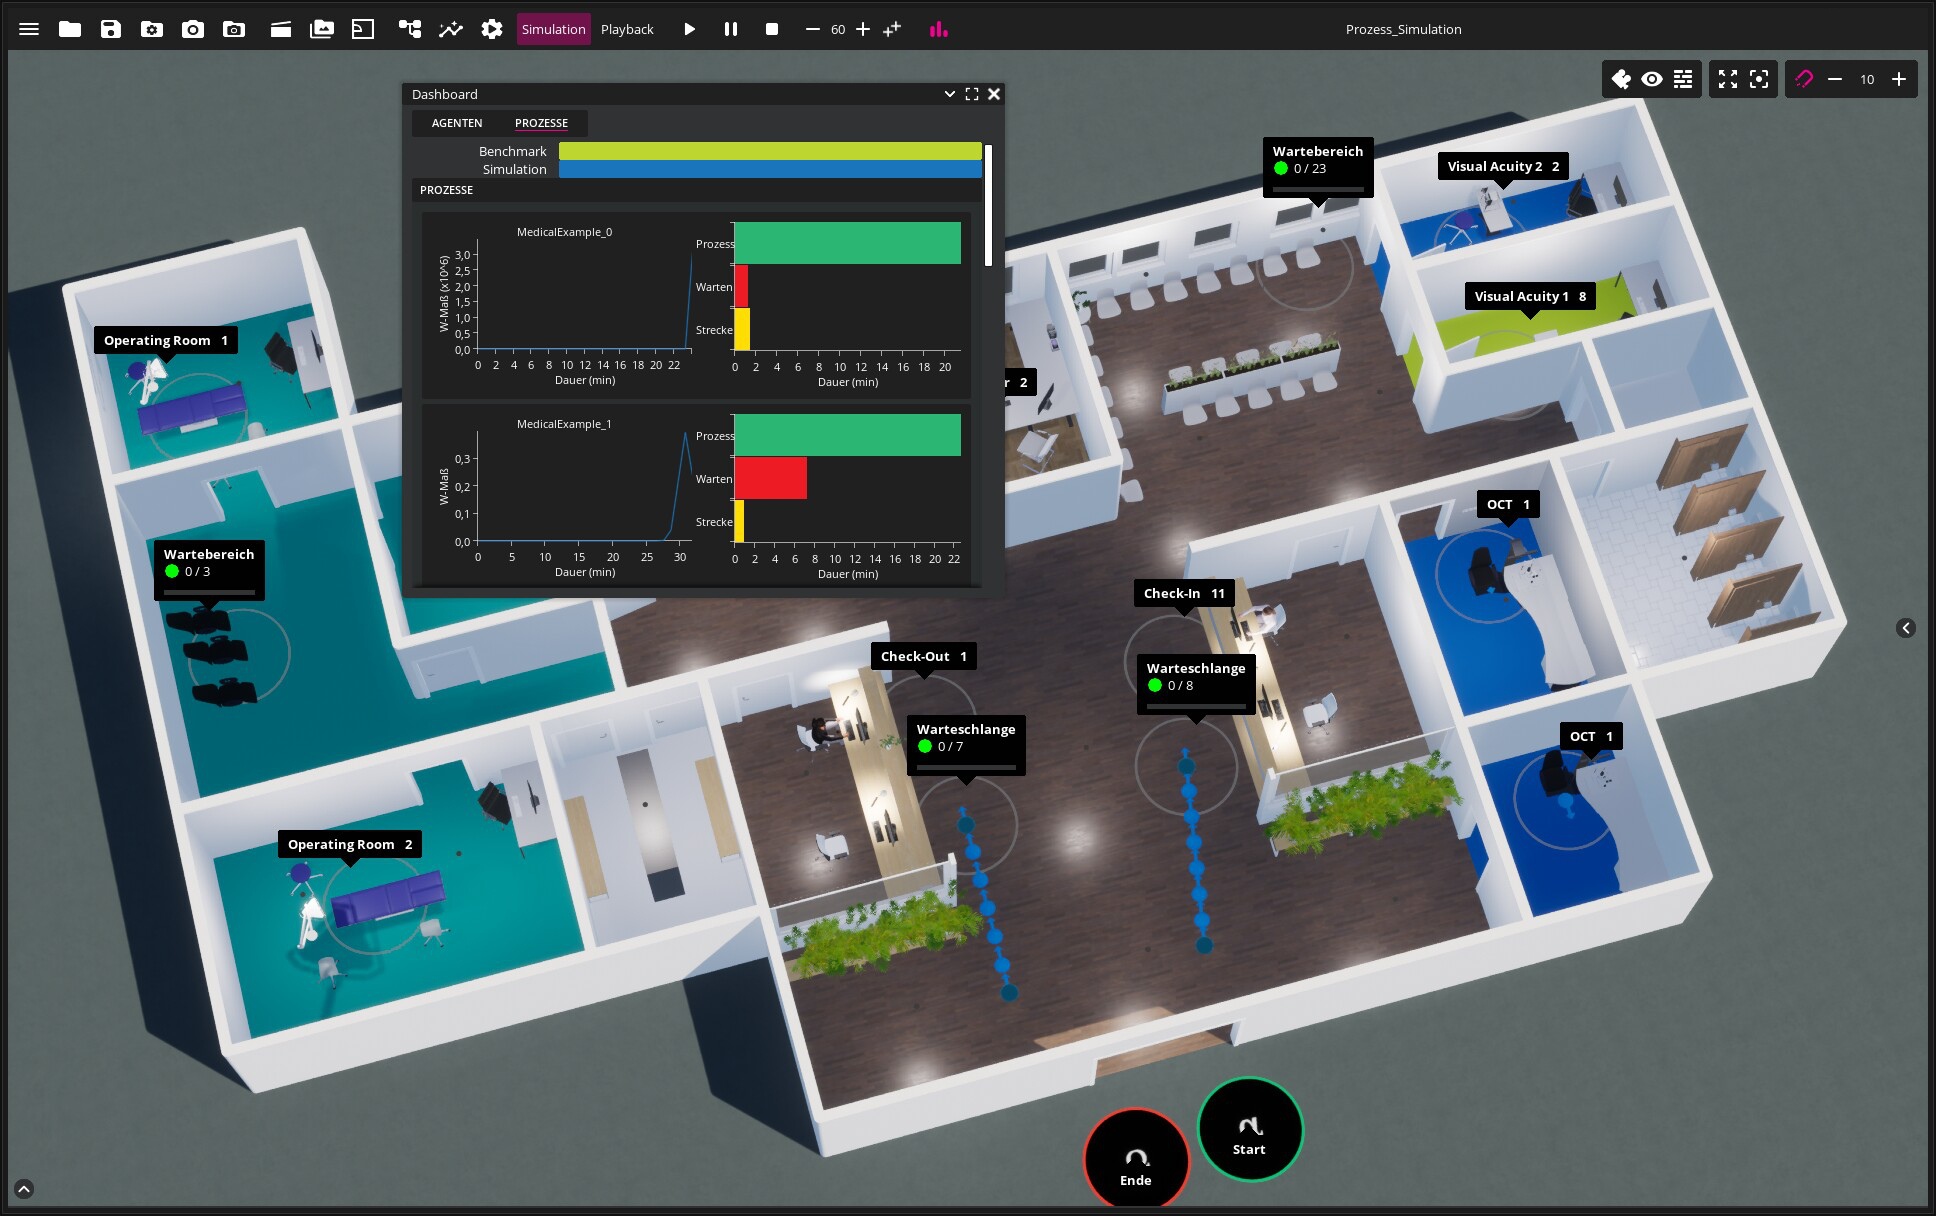
Simulate
Simulate your processes live in the virtual environment. Get a tangible, three-dimensional picture and identify bottlenecks or weak points.
- Simulation of multiple process flows in space and time
- Defining or reading process parameters
- Change in real time parameters, such as the amount of stations, spatial changes or the frequency of agents
- Dashboard for data analysis
Communicating knowledge
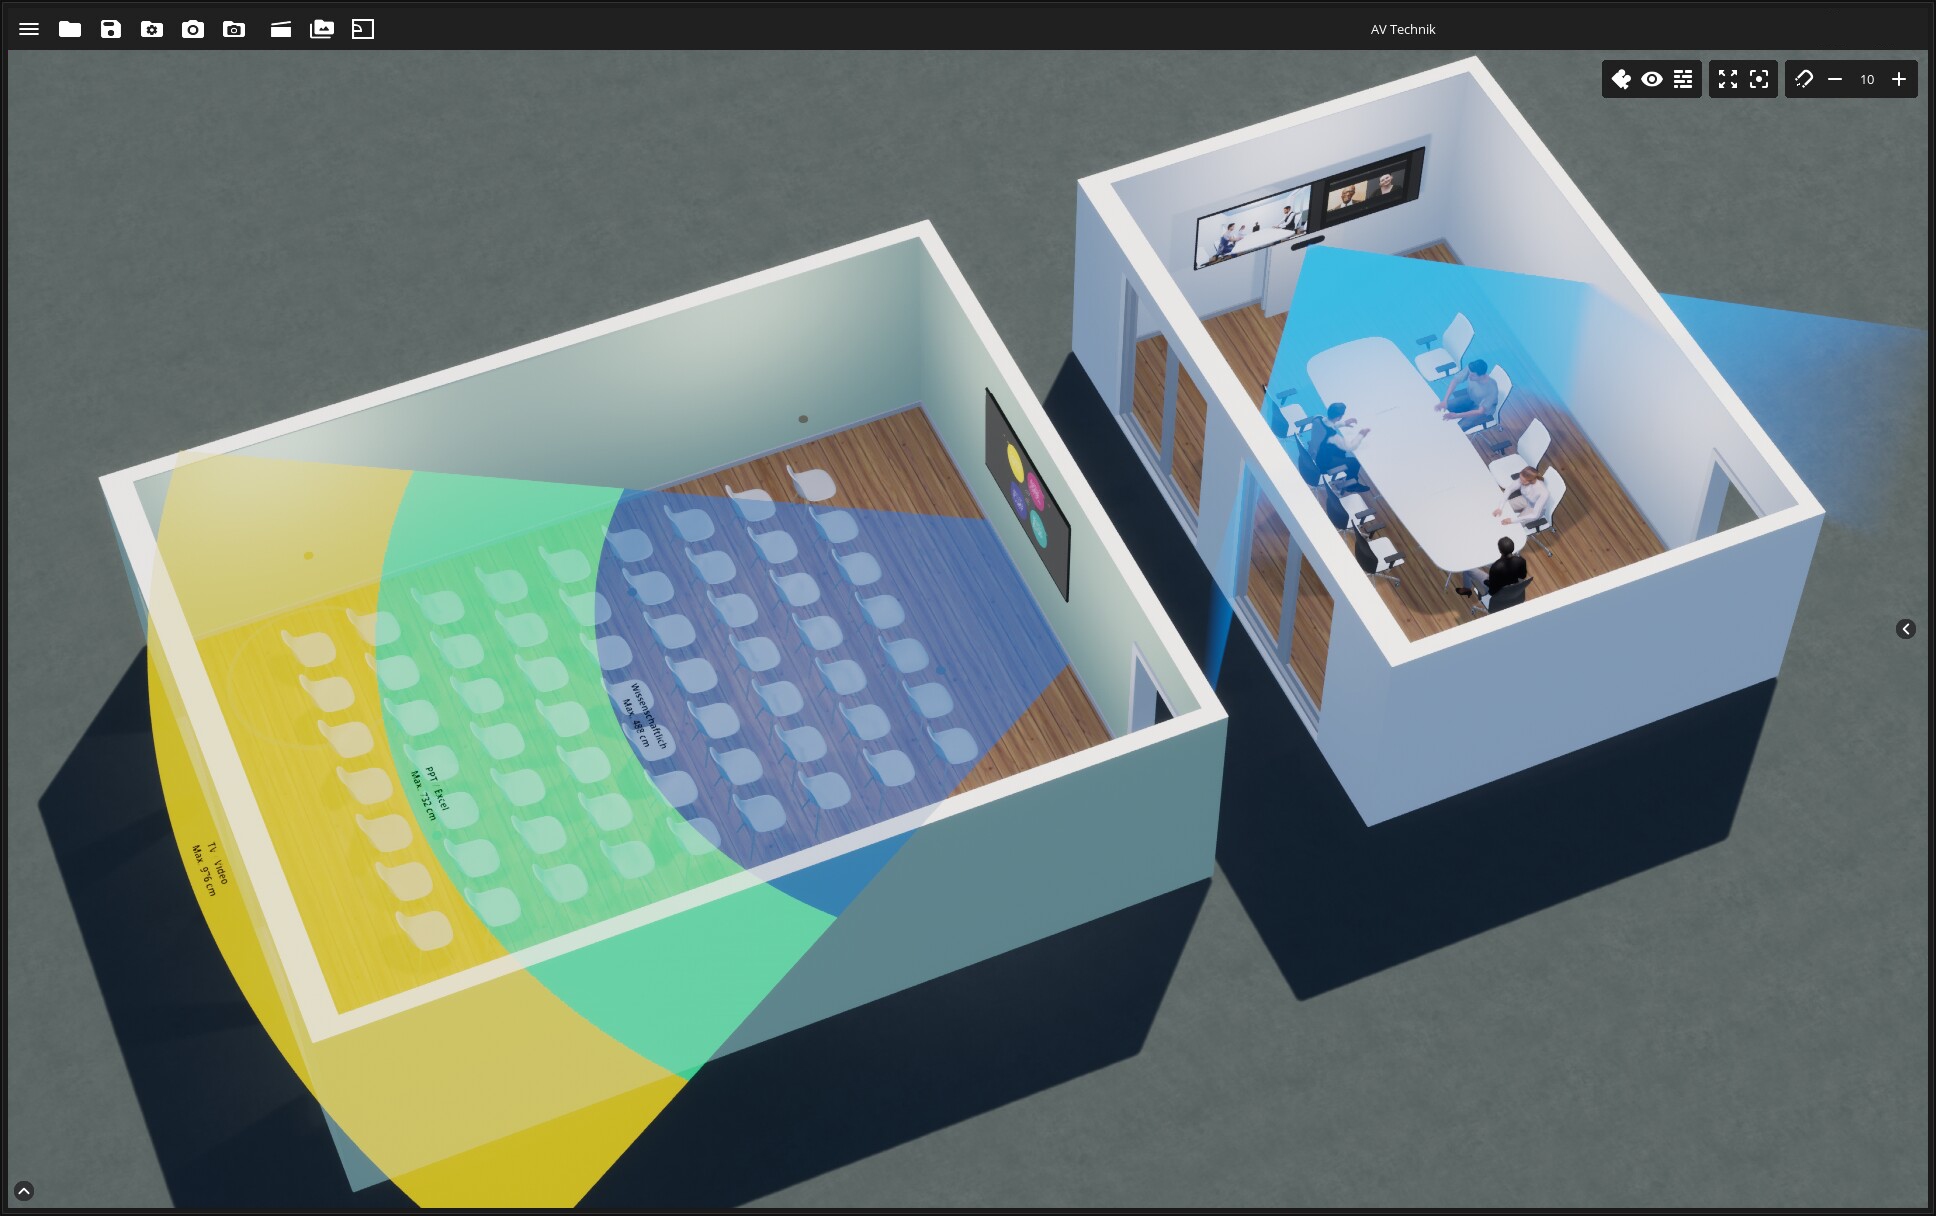
Making the invisible visible
Viewing distances of media technology, the FOV of a camera, infrasound from wind turbines - show what remains hidden to the eye.
Show & tell
Present complex relationships and processes in the virtual world in an appealing and understandable way. Stakeholders and target groups receive a clear overall picture that can be quickly coordinated. Communication becomes child’s play.
Experiencing Space and Process up close
Choose between top down view, running, flying or VR headset modes. Immerse yourself and be part of your planned future.
- Its good
- and 3d
- its got elecrolytes
Present Results
Besides screenshots, simply create a tracking shot and wow your audience, use it like a PowerPoint presentation or create a video for your performances.